
While the Google search engine doesn’t share exactly how many searches are performed, it’s estimated that Google handles approximately 63,000 search queries every second. As Google has continued to grow and evolve over the years, the company has developed tools to help companies and business owners better understand their own website traffic. Google now provides a complete suite of free tools that allows you to track how users find and interact with your website, including the most well-known component, Google Analytics.
Much like its name suggests, Google Analytics allows a user to analyze their website’s data in an interactive platform and track trends and performance over time. Google collects a lot of information, so what does all of it mean and how can it be used to better inform your marketing decisions? Diving in head first to Google Analytics can be daunting, but we’ve broken down the basic elements below to help you better understand how Google Analytics is structured and what to focus on as you explore the data it contains.
Four Categories of Data
Google breaks down its tracked website metrics into four main categories: audience, acquisition, behavior, and conversions. In essence, Google gathers information about the people visiting your website and then breaks it down so you can better understand the data from different perspectives. It’s easiest to see this information as a flowchart:

- Audience: WHO is visiting your website? This includes the number of users who visit your website, what type of device they used (e.g., desktop, mobile phone, or tablet), where they live, their age and gender, etc. The number of users arriving to your website is commonly referred to as “traffic.”
- Acquisition: WHERE did this visiting audience come from? Users can find their way to your website via a lot of different methods. For example, they can type your URL directly into a website browser, they can use a search engine to find your law firm by name or through relevant keywords, they can click on one of the various types of ads you may be running, or they can click a link to your website from another website. The acquisition section of Google Analytics breaks down the traffic sources that send users to your website so you easily see how many users are arriving via organic search, social media channels, Google AdWords, etc.
- Behavior: WHAT did users do once they arrived to your website? Here you can find out what content is resonating with users, what pages are earning the most traffic, and how users are navigating through your website. A thorough and technical analysis and review of this section can show issues and errors with a website that are directly and negatively affecting the user experience.
- Conversions: HOW MANY website visitors did something important? This section allows you to set up goals that are meaningful to you, like when a website visitor submits a contact form or clicks-to-call your law firm’s phone number from a mobile device. Setting up goals does require more advanced knowledge of Google Analytics, but it is a one-time only set up process that helps you collect a lot of additional valuable information on an ongoing basis.
In order to more easily break down the terminology used, we’ll use John and Jane as two Internet surfers who come across your website to better illustrate how to interpret the data – focusing primarily on the two categories that provide the majority of raw data: audience and acquisition.
Audience
The audience overview provides you with much of the relevant raw data you will need to track the WHO portion of traffic to your traffic.
- Users: The exact number of users who arrive at your website during the specified timeframe. Let’s say you are looking at data for a single day. If both John and Jane (and only John and Jane) visit your website, then you would have two unique users.
- New Users: These are users who have never visited your website before. Let’s say John visited your website last month, but Jane has never been to your website before. Then you would have two total users and one new user.
- Pageviews: Much like it sounds, this is the total number of individual webpages viewed. Let’s say John visited the (1) homepage and the (2) contact page. Jane visited the (1) homepage, (2) one of the attorney biography pages, and (3) a blog post. The total pageviews across both users would be five.
- Sessions: This metric starts to combine some of the individual data, in that a session consists of all of the activity conducted by a single user at one time (or during one “session”).
- Number of Sessions per User: A user can engage in more than one session if they visit your website more than once during the selected timeframe. If John visited your website once on Monday and then again on Friday, that would represent two sessions per user in one week.
- Pages / Session: A session often includes multiple pageviews if the user clicked through to visit more than one page on your website. For instance, assuming Jane visited or viewed three pages in one session, she would have visited 3.00 pages / session.
- Average Session Duration: The average session duration is exactly that – the average length of a session. If John had one session lasting 30 seconds and Jane had one session lasting two minutes, then the average session duration would be 1:15 (one minute and fifteen seconds).
- Bounce Rate: A bounce is a single-page session on your website. This occurs when a user lands on a page and then leaves your website without visiting any other webpages. The higher the bounce rate, the more users who are only visiting a single page on your website. For example, if John clicked on a blog post you shared on your Facebook Page, landed on that page of your website, read the blog post, and then closed his Internet browser window, this would still count as a bounce since he never visited a second page of content.
Analyzing Your Audience Data
Within Google Analytics, it is most important to analyze trends over time along with comparisons of your metrics to legal industry averages. Here a few questions to ask as you look at the data pulled from your Google Analytics account:
Is the number of users arriving to your website increasing or decreasing? While some fluctuations month-over-month are normal, if you see a declining trend in website visitors over time, this often indicates a larger issue that needs to be addressed.
Is the average session duration over one minute? In general, you want to see an average session duration of at least one minute. This indicates users are generally finding your website visually pleasing, easy to navigate, and engaging enough to spend time at least skimming your content.
Is your bounce rate high? Legal industry websites tend to run on the higher side of bounce rates, averaging around 60.00% to 70.00% – so don’t be alarmed if your bounce rate falls within this range. If your bounce rate is lower than this, it means users are visiting more than one page of your website, which is great news. If your bounce rate is much higher than this, it means users do not like what they see when they arrive to your website and are choosing to leave without visiting another page. Spend some time evaluating the user experience, and make sure you don’t have any technical issues (like a slow page load time) that might be impacting your website’s performance.
Acquisition
Now that we’ve established WHO is arriving to your website, the next step is finding out WHERE they came from. This information is found in the acquisition section of Google Analytics, and is broken down by category or “channel.”
The acquisition section details what channels drive the most users to your website. Google breaks the data down into several default channels, including:
- Direct: The “catch-all” channel for Google, direct traffic includes anyone who types in your direct URL, but it also includes any traffic for which Google is unsure of the source.
- Organic Search: Users who arrive to your website by seeing your website in organic search results (such as Google, Bing, or Yahoo), clicking on that search result, and landing on your website.
- Social: Users arriving to your website after clicking on a link shared on a social media channel like Facebook or LinkedIn.
- Email: Anyone landing on your website after clicking on a link shared in an email (e.g., if your law firm sends out an email newsletter).
- Paid Search: If your law firm is running a Google Ads campaign or other type of pay-per-click advertising campaign, users landing on your website after clicking an ad would fall under this category.
- Referral: If another website contains a link back to your website and a user clicks on that link, the inbound traffic is considered “referred.” For instance, if John clicks on a link to your website in your Avvo profile, then he was referred to your website from Avvo.
Analyzing Your Acquisition Data
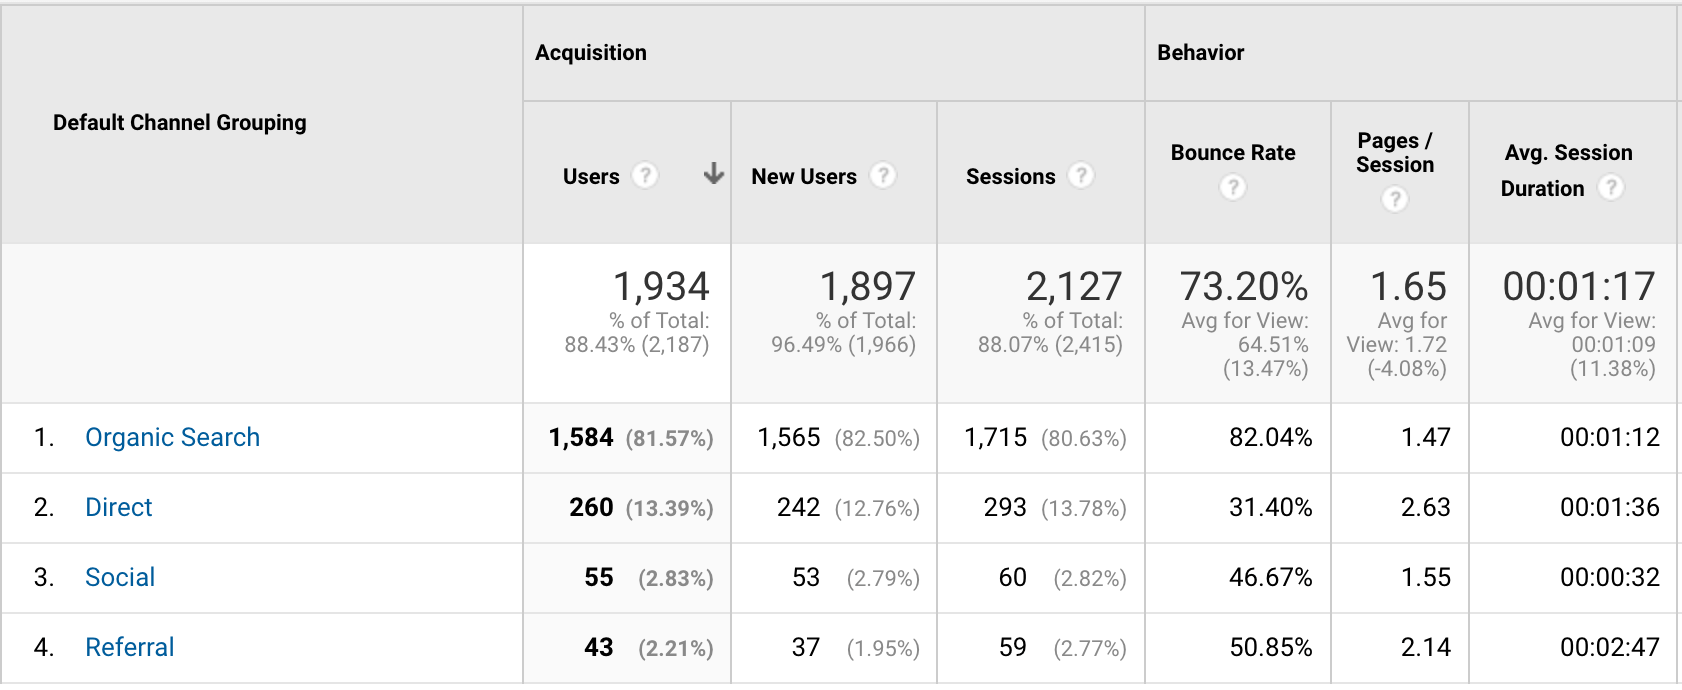
This section starts to combine data points, and allows you to break down your audience by channel. In the example below, we can see that 81.57% of the traffic to this website for the specified time frame arrived via organic search, 13.39% from direct traffic, 2.83% from social, and 2.21% from referral sources.
Here a few questions to ask as you dive into the acquisition section of Google Analytics:
Are you seeing traffic from multiple sources? Having a mix of acquisition sources is a good thing, as you don’t want all of your proverbial eggs in one basket. The ratio of sources depends on what type of adverting and/or marketing campaigns you are running, but ideally you don’t want the majority of your traffic classified as direct traffic. If this is the case, it can mean your website isn’t performing well in organic search results or that your firm is actively running offline campaigns like billboards and direct mailers that use the main website URL without a tracking mechanism.
If you are paying marketing vendors for campaigns, are you seeing results? For instance, if your law firm is investing in a search engine optimization (SEO) campaign, you should see a large percentage of your website traffic arriving via organic search and this should increase over time.
How do users referred to your website by different channels behave once they arrive? Bounce rate, pages per session, and average session duration metrics all provide additional information about the different segments of users. As we take a look at the example above, users arriving via social media channels have a relatively low average session duration. This means you may want to take a look at the type of content you’re sharing on social media channels as it’s not resonating with those users.
Behavior
Next, we take a look at WHAT pages users visited on your website, including which pages received the most pageviews for the specified timeframe. This can and should help inform future content additions to your website. As we can see in the example below, the blog post How to Write a Speaker Biography is one of the most visited pages on our website. There is a high level of interest in this topic, and we can use this information to produce future related content.
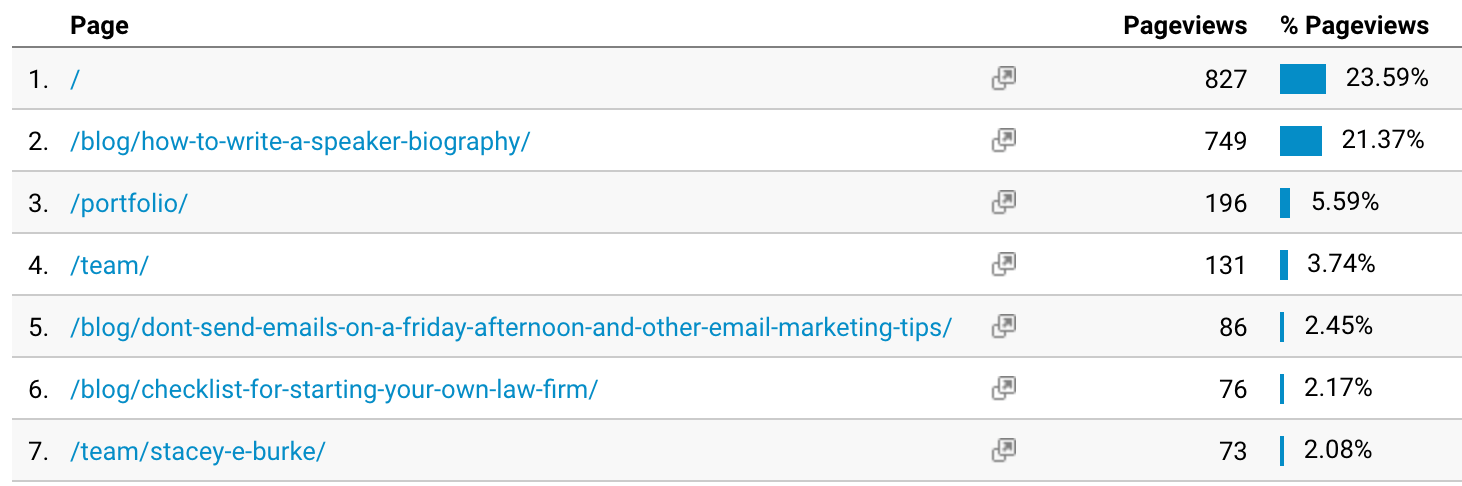
You can also use this data to determine if any pages need to be refreshed or updated. For instance, lawyer biographies are often among the most visited webpages on law firm websites and should therefore be updated on a regular basis with recent award wins, speaking engagements, and other relevant items. If your case results or representative matters page (or in our example above, portfolio page) receives a lot of traffic, then make sure it remains up-to-date with fresh content. The last thing you want is users landing on these types of pages and finding outdated content, as the expertise and talent of your lawyers and the successes you are able to achieve for your clients (your results) are two of the biggest selling points of your law firm.
Conversions
Conversions let us know HOW MANY people took an action once they arrived to your website. While conversions are incredibly important, it requires a more advanced set up process in order to track these results. We recommend working with a marketing professional in order to create effective conversion tracking parameters for your law firm website in your Google Analytics account.
Ready, Set, Analyze!
Now that you’re equipped with a better understanding of Google Analytics, it’s time to explore and find out what’s happening with your website. Understanding your website traffic is the foundation of digital marketing, and Google Analytics provides a wealth of information at the drop of hat. Even if your law firm works with paid marketing vendors, having a better understanding of the terminology used and the platform itself can help you hold your vendors accountable and ensure you are not wasting money and achieving the maximum possible return on investment (ROI).


Leave a Comment