
If you’ve ever logged into Google Analytics for your law firm’s website, you’ve likely been flooded with numbers and statistics, but do you know what they all mean? Metrics like “users” and “sessions” are easy enough to understand, but if you don’t dig any deeper into your website’s analytics, you are missing out on an opportunity to understand your audience and the effectiveness of your website.
Numbers Explained
Bounce Rate
Bounce rate refers to sessions where users only visited one page on your website. For example, if a user performed a Google search and then clicked through to your website in the search results, but then left your website after viewing only one page, this is considered a bounce. Because you want users to interact with your website and visit multiple pages, you want a low bounce rate. If your bounce rate is unusually high, it could mean your content is lacking or your navigation is confusing to the user. Not all bounces are bad – sometimes a user finds what they are looking for on the first page and doesn’t need to continue to other pages. The best way to understand bounce rate is within the context of other analytics. If you have a high bounce rate, but users spend several minutes on your site on average and you receive contact form submissions, then a high bounce rate shouldn’t be as concerning.
Percent Exit
Also called exit rate, this statistic is often confused with bounce rate, but it has an important difference. Bounce rate refers to users who only visited one page on a website, but exit rate refers to all users. The exit rate of a particular page is equivalent to the percent of users that ended their sessions on that specific page. High exit rates could indicate some serious problems with website pages. If a particular page has a high exit rate, the content could be offensive or off-putting, or the user may have nowhere else to go, whether through internal links or navigation. Just as with bounce rates, high exit rates aren’t always bad. For example, it is not unusual for a contact page to have a high exit rate. If users choose to visit a contact page, its usually because they have decided to reach out to the company, and once they do so, this concludes their session and you should have a new lead. As with bounce rate, exit rate is best understood in the context of other analytics.
Referrals
Referrals detail how a user reached your website. Referrals are broken down into several categories: direct, organic, social, paid, email, and other websites. Direct referrals are users who opened up their Internet browser and typed your law firm’s domain name (www.yourlawfirm.com) into the URL bar. Organic referrals include users who search for a keyphrase via Google and select your website from the list of organic (or natural) search results. Social referrals are users who click to your website from a social media channel like Facebook or Twitter and paid referrals are users who clicked through to your website through a paid advertisement like Google AdWords. For law firms engaging in email marketing, email referrals tell you how many users clicked through to your website through your emails. Finally, some referrals come from other websites listing your law firm website. The ratio of referrals is incredibly important. If you have an unusually high number of direct referrals, it could mean you and people in your office are visiting the website frequently, skewing your website data. If you have a low number of organic referrals, it means your website doesn’t have much credibility with search engines, and you need to implement an SEO strategy to generate organic leads from your website. Social, email, and paid referrals help you understand what is and isn’t working in your existing marketing efforts.
NOW WHAT?
Whether you understand bounce rate, percent exit, and referrals, or you still struggle with what they mean for your website, seeing these numbers visually can help you understand them in the context of your website. If you have Google Analytics installed on your website, the Users Flow (also known as Behavior Flow) is a map of how users interact with your website.
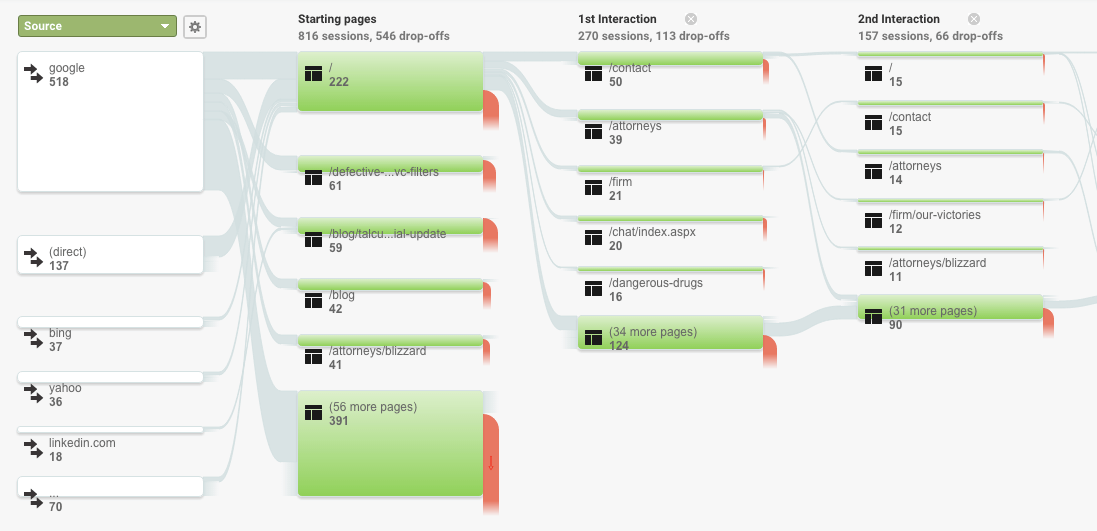
User flow tells you where users came from (referrals), what page they landed on first, and if they continued on to other pages (bounce rate and exit rate). Seeing these statistics together can help you understand what they mean in the context of your whole website, and help you know where you need to make adjustments.
Understanding website analytics is hard enough, but you also need to use this information to make thoughtful changes to improve your website. If you aren’t sure how to do this, just ask the experts at Stacey E. Burke, P.C.


Leave a Comment